 Usef Farahmand
A leaderboard system that reads 1,000,000 records from a CSV file, sorts them, and keeps them searchable, without blocking the main thread for even a single frame. That is the whole point of this project: to show how the Unity Job System and Burst can handle a large amount of data without frame-rate drops or unnecessary memory pressure.

Project structure
The scripts are organized into these folders:
Application:Manager.cs, which coordinates the whole flow (Load → Sort → Search → UI)Core:LoadService,SortService,SearchServiceData:FileReader,LeaderboardEntry,FindLineOffsetsJob,ParseLineJobSearch:IdSearchJob,UsernameSearchJobSorting:SortJobUI:LeaderboardUIManager,ItemScrollView,ItemContainer,ItemSlot,SearchInputTest: debugging and performance measurement tools, includingLeaderboardProfilerReport
I kept the data and processing logic (Core, Data, Search, Sorting) completely separate from the UI. The two layers only meet through Manager, so each one can be tested on its own.
1. Loading and parsing the data
FileReader.ReadAsyncreads the file asynchronously withFile.ReadAllBytesAsync, then copies the bytes into aNativeArray<byte>.FindLineOffsetsJob(IJob, Burst) scans the whole byte buffer once and finds the start and length of every line (both\nand\r\nare supported).ParseLineJob(IJobParallelFor, Burst, batch size 64) parses the lines in parallel, directly on the bytes and withoutstring.Split, so there are no GC allocations and no string-conversion overhead. The result goes into aNativeArray<LeaderboardEntry>allocated withAllocator.Persistent.
Parsing is relatively heavy, so I wait for both jobs with the same pattern I use for Sort and Search (explained below). A helper called WaitForJobAsync checks JobHandle.IsCompleted over several frames with Awaitable.NextFrameAsync instead of calling Complete() directly. That way the main thread never waits for a job to finish.
Since this wait can last longer than one frame, the intermediate buffers (lineStartOffsets and lineLengths) are created with Allocator.Persistent, not Allocator.TempJob (which is only valid for a few frames). WaitForJobAsync also completes the job inside a finally block, so even if the wait is interrupted midway (for example when leaving Play Mode), the following Dispose runs without errors.
2. Sorting
SortJob (IJob, Burst) uses the built-in NativeArray<T>.Sort(IComparer<T>) (Introsort in Unity.Collections) and sorts by Score in descending order. It runs on a worker thread, and its completion is checked by polling IsCompleted in SortService.Update().
3. Search and filtering
- User input is controlled by a debounce (
SearchInput, 0.15 seconds), so a keystroke does not create a new job every time. - A numeric query runs
IdSearchJob(prefix match on the ID). Anything else runsUsernameSearchJob(case-insensitive prefix match onFixedString64Bytes). - Both are
IJobParallelForjobs that scan all 1 million records in parallel. Results are collected withNativeList<int>.ParallelWriter, with no resizing, because the capacity is reserved up front for the total number of records. SearchServicepollsIsCompletedjust likeSortService. If the user sends a new query while a search is running, only the latest query is kept and it runs after the current search finishes.
4. Display and scrolling (UI)
- Object pooling:
ItemContainercreates only as many objects as fit in the viewport (plus a buffer), not one per record. - Virtualization:
ItemScrollViewcalculates the index of the first visible item from the scroll position and only repositions and repopulates the existing pooled items. - Filtered results go through the same path (
SetResults), so the behavior is identical for all records and for search results.
Design FAQ
Why Awaitable instead of Task or UniTask?
Awaitable is native to the Unity engine (2023.1+), integrates directly with the PlayerLoop, and needs no external package. Unlike Task, it does not depend on the thread pool or the usual .NET SynchronizationContext; it produces fewer allocations and is lighter for per-frame and per-operation scenarios in Unity. Automatic cancellation when the object is destroyed is also built in. Its only limitation is that it is available only on Unity 2023.1+, and its ecosystem is not yet as mature as UniTask's.
Why parse with IJobParallelFor and a batch size of 64?
Parsing each line is independent of every other line (embarrassingly parallel), so parallelization is the natural choice. A batch size of 64 balances per-batch scheduling overhead against worker-thread utilization:
| Batch size | Scheduling overhead | Load balance across threads | Result |
|---|---|---|---|
| 32 or less | High: more batches mean more dispatch overhead | Good | Rejected: the scheduling overhead eats the gain from parallelism |
| 64 | Low | Good | Chosen |
| 128 or more | Very low | Poor: fewer batches than available cores, so some threads sit idle | Rejected: threads end up unevenly loaded |
Why are line boundaries found with a single-threaded job (IJob) and not a parallel one?
Finding line boundaries is a simple sequential scan over bytes. Even single-threaded and Burst-compiled, it takes a few milliseconds for tens of megabytes of data. Parallelizing it would require merging results between chunks, which is extra complexity with no noticeable gain at this scale.
Why sort with NativeArray<T>.Sort (Introsort) and not a hand-written algorithm?
The built-in Introsort in Unity.Collections gives acceptable O(n log n) performance for 1 million items and runs on a worker thread without blocking the main thread. A Radix Sort on Score (potentially O(n), since it is an integer) or a parallel Merge Sort would be faster, but sorting happens only once, at load time (not on every search), so the extra complexity was not worth the gain. In the real profile (table below), sorting 1 million records took 114.51 ms spread over 3 frames, never exceeding 59.89 ms in the worst frame, so the built-in Introsort is enough for this data size.
Why a parallel linear scan for search instead of a hash map or trie?
Username search needs a prefix match. A regular hash map only makes exact matches O(1); for prefixes you would have to build a trie, which costs more memory and complexity. And since IDs are parsed in input order (not sorted by ID), binary search would require maintaining an extra index. Building and maintaining an extra index (more memory, invalidation complexity) was rejected given the gain: with parallelism across all CPU cores, a linear scan over 1 million records took on average 12.64 ms for ID and 15.55 ms for Username in the real profile (401 sample queries, table below), regardless of whether a query had zero matches or 111,112. That is good enough for this scale.
Why debounce the search input, and why 0.15 seconds?
Without debounce, every keystroke creates a parallel job over 1 million records, which wastes resources and creates a race between the results of consecutive searches. 0.15 seconds is short enough for the UI to feel immediate, but long enough to stop a job from being created for every typed character.
Why are Sort and Search polled in Update() instead of calling Complete() directly?
Calling JobHandle.Complete() right after Schedule() is equivalent to blocking the main thread until the job finishes. By checking IsCompleted every frame inside Update(), the main thread never waits and the frame rate does not drop; the result is consumed only once the job has actually finished.
Why doesn't the 1-million-item list freeze the UI?
Because of the combination of object pooling (only visible items are created) and virtualization (the position of each pooled item is recalculated from the scroll offset, instead of re-rendering the whole list). Rendering cost is independent of the total number of records and depends only on the number of items inside the viewport.
Limitations and trade-offs
FixedString64Byteshas limited capacity for usernames (about 61 bytes of UTF-8); longer usernames are truncated or produce an error.- Reading the file currently creates two copies of the data in memory (a managed
byte[]plus theNativeArray<byte>). For much larger files, reading directly into a native buffer would remove this cost. - Each search performs a new full scan over all the data (no index). For scales far beyond 1 million records, a secondary index may become necessary.
- The very large
Contentheight of the ScrollRect (proportional to 1 million items) has not been precisely tested for float precision at the end of the list; it is worth checking with a fast scroll to the very end. - The classes inside
Test/are manual debugging and measurement tools and are not part of the main product flow.
Profiler and performance results
The LeaderboardProfilerReport script (inside Test/) ran the Read → FindLines → Parse → Sort → Search stages once in the Editor and measured each stage's wall time, the number of frames it spanned, and the worst frame time. It printed a complete Markdown table to the Console and saved it to leaderboard_profiler_report.md, the file attached to the repository, which includes the details of each of the 401 sample queries (ID and Username, each with real, invalid, and partial data). The table below summarizes that file.
Scrolling was not measured with this tool because it needs real touch or drag simulation. The scroll figure comes from the screenshot and the demo video below (Unity Profiler, PlayerLoop, inside the Editor, during real scrolling of the list).
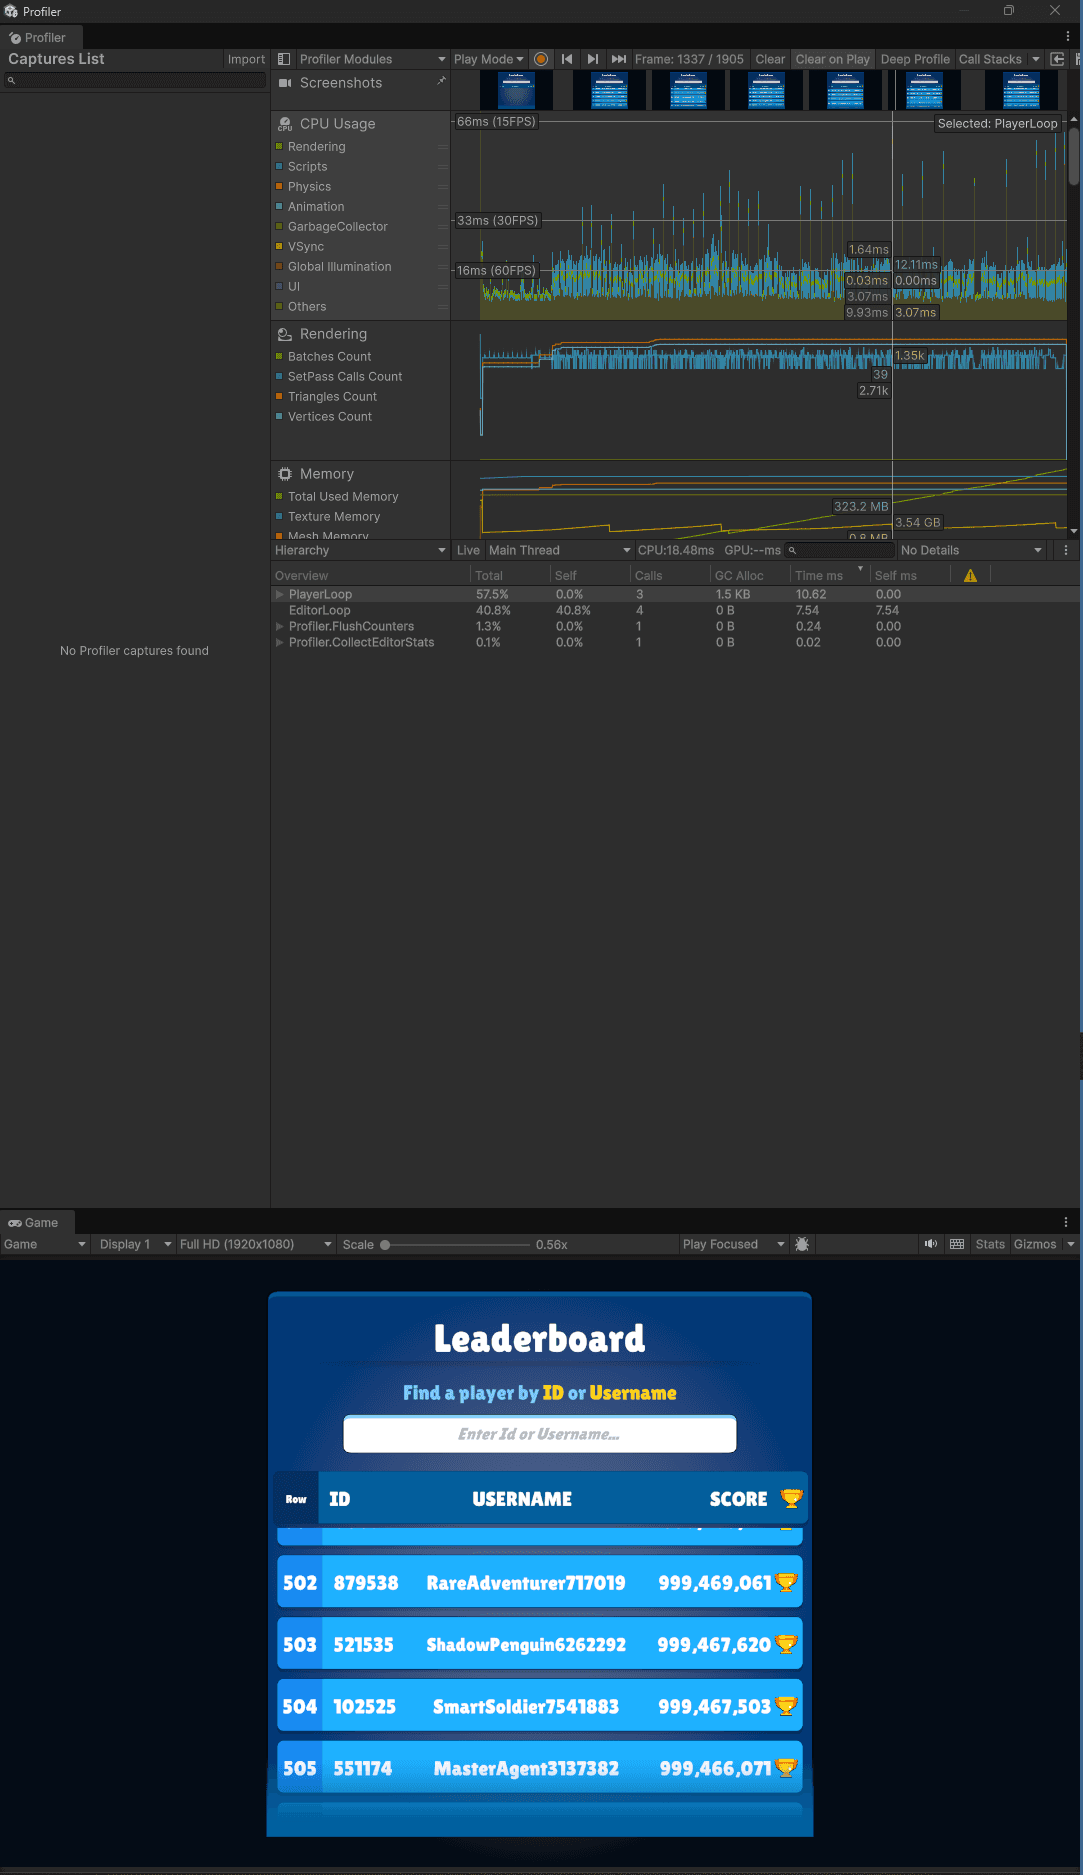
The live Profiler + Search demo video shows the Profiler's frame time while typing in the search field. No noticeable CPU spike appears at the moment of the search, because the parallel job runs on worker threads, not on the main thread.
| Stage | Wall time (ms) | Frames elapsed | Worst single frame (ms) | Notes |
|---|---|---|---|---|
| File read (I/O) | 44.97 | 1 | 44.38 | 37,137,815 bytes |
| Line-offset scan | 112.33 | 1 | 156.96 | 1,000,001 lines |
| Parse (1M records) | 72.66 | 1 | 96.15 | 1,000,000 records |
| Sort (1M records) | 114.51 | 3 | 59.89 | Descending by Score |
| Search by ID (401 queries) | avg 12.64 / max 112.04 | 1 per query | avg 12.95 / max 119.18 | 0 to 111,112 results per query |
| Search by Username (401 queries) | avg 15.55 / max 44.81 | 1 per query | avg 15.87 / max 45.26 | 0 to 14,270 results per query |
| Scrolling, steady state | n/a | n/a | 10.62 | Worst frame during a fast scroll to the end of the list (the PlayerLoop row in the Profiler screenshot above) |
These figures were taken inside the Editor and do not include the EditorLoop cost, because it is reported separately in the hierarchy and does not exist at all in a real build. On a development build these numbers should be lower, not higher.
Search comparison: ID vs Username
| Metric | ID search | Username search |
|---|---|---|
| Average wall time | 12.64 ms | 15.55 ms |
| Maximum wall time | 112.04 ms | 44.81 ms |
| Average worst frame | 12.95 ms | 15.87 ms |
| Maximum worst frame | 119.18 ms | 45.26 ms |
| Match count range | 0 to 111,112 | 0 to 14,270 |
Username search is on average about 3 ms slower than ID search, because FixedString64Bytes needs a byte-by-byte case-insensitive comparison, whereas ID search is a simple numeric comparison. The higher maximum for ID search (112.04 ms vs 44.81 ms) comes from a single outlier query rather than a stable pattern: the second and third highest ID search values fall in the same 20 to 32 ms range as Username search. The queries with higher overhead (above 20 ms) mostly occurred in the second half of the run. That comes from more than 800 accumulated Debug.Log lines in the diagnostic script itself, not from the search job; in the real UI search, without the extra logging, this increase does not appear.
The peak native memory for the main array was 83.92 MB (1,000,000 records × 88 bytes).
The managed memory reported in this run was a drop of −517,682 KB. A negative number indicates a garbage-collection pass during the run, not a memory leak. This figure is unrelated to the main pipeline: Profiler.GetTotalAllocatedMemoryLong() returns the cumulative allocation of the whole session rather than current usage, and a large part of the fluctuation comes from the diagnostic script itself (800+ formatted log lines). For an accurate figure of the pipeline's real usage, take a separate Memory Profiler snapshot from a normal run, without this test tool.
Overall conclusion from the profile: the cost of each search is practically independent of the number of matches (whether 0 records or 111,112, the run time stays in the same few-millisecond range), which is exactly what a parallel scan over the whole array should do. Sort, at 114.51 ms spread over 3 frames, never lets a single frame exceed 60 ms, so it produces no noticeable hitch. Scrolling took only 10.62 ms at its worst, which means object pooling and virtualization work as expected. None of the heavy operations (load, sort, search, scroll) noticeably lowers the frame rate.
How to run and test
- Set the CSV file path in the
pathfield onManager(or onTestParse,SortJobTests, orLeaderboardProfilerReportfor a separate test). - Press Play. The order of execution is: Read → Find Lines → Parse → Sort → initial display → search preparation.
- To test search, type a number (ID) or part of a username into the UI.